
Map work and navigation is the basis of understanding one’s environment and how to move within it. Navigation has been a part of everyday life since the dawn of time and will continue to be so, even as we enter the space age.
Finding our way has always been the forerunner of exploration, the discovery of the new and the wonders it holds. When the Vikings reached the Americas, they did so with no maps. The new world was just that, new. The same holds true for Columbus.
Maps and mapping predate the compass by thousands of years, ensuring that we have always held map makers or cartographers in high regard across the world, their drawn lines demystifying to world.
As a species we are obsessed with understanding our world and everything in it, we want to unravel our world and give it meaning. This, need to comprehend drives discovery and exploration, pushes the boundaries of invention, innovation and technological advancement.
In this article we will focus on navigating our world using maps without a compass. Before we explore the world, I will help guide you through what maps consist of:
- ☑ What the symbols mean
- ☑ Grasping scale and its application
- ☑ Magnetic declination
- ☑ Topographic lines
What is a Map?
The map is a composite drawing, a representation of the shape or the topography of a land and sea mass. A map outlines land features using a series of topographic lines to show land features in a two-dimensional format.
Contained on its pages are grid references which align with the earth’s lines of longitude and latitude. These references allow us to establish our current position relative to land features that are present, giving their height above sea level.
On the open sea, without the benefit of land features seafarers use the sun, moon and the celestial expanse.
Combined with the concept of dead reckoning, which is navigation from a known point, measuring speed, referencing direction and combining natural occurrences, i.e., currents, winds and the direction of each.
Types of Maps
- Land maps
- Sea Maps or Naval Charts
- Aerial Maps
- Celestial Maps
There are a number of more specialized maps that cover very specific areas of the natural world:
- Weather Maps
- Sea Currents for Specific areas
- Road Maps and Neighborhood Maps
- Three Dimensional Maps
There are maps of the human body, the brain, the nervous system, the cardio vascular system, and the list goes on.
The Aim of Map Reading
A map is a guide. Reading the map enables the user to match the ground to the representation on the map and the map to the ground. The recognition of land features and use them to orientate the user to the environment., enabling navigation from a given point to another point.
Remember the old pirate maps promising hidden treasure and the promise of adventure and fortune. These old maps are portrayed as having recognizable features that guide the seeker to the X marks the spot.
Modern maps are no different. If anything, they are more sophisticated and user friendly, with precise units of measurement and scale, an aerial view of the topography with vegetation, rivers and landscape features laid out.
Using the map will enable you to find your way and navigate abut an area in confidence even if you have never seen it.
Care of the Map
Look after the map, it is made of paper and is susceptible to tears, water damage and dirt. The damage can obscure vital information.
Keep your map in a sealed plastic map case or at a minimum zip lock bag. Maps are stored folded, reinforce the fold lines with clear tape to preserve the edges.
Interpreting the information supplied on a map is like learning a new language, begin with the basics until you are comfortable with their use and application. Regular practice will lead to familiarity that makes map reading easy and simple.
A Word on Map Measurements
Humanity has developed over the millennia into a varied and diverse species, each segment devising different ways of determining lengths of distance, area and direction. The common denominator is that they all define the same space.
The metric system and the imperial system are the most widely used mathematical systems of measure used in the world.
In the USA its inches, feet, miles and in Europe its centimeters, meters and kilometers.
This difference influences the way distance and scale are measured on maps. Nature has no care for metric or imperial, these are manmade constructs and do not influence the ground or the map to ground.
What matters is how we determine distance on the map in relation to the ground. If a map is scaled in inches using the incorrect system of measure will throw your calculations out significantly. Therefore, it is vital to familiarize yourself with the topographic maps you are using.
The United States Geological Survey or USGS, is the bureau within the Department of the Interior that covers the production ad distribution of topographic maps for the USA.
The USGS allows for free down loads of 1:24000 scale topographical maps for public access and use. Planning your next trip not the wilderness or for training purposes you can start here to access your map.
The criteria for applying scale, measurement and direction remain exactly the same, only the miasmatical system in use in your location will differ.
Map Layout and Interpretation
Map Title
The name of the map, this name is taken from a major city, town or similar human settlement or from the areas landscape features.
Sheet Number
Titles usually have a sheet number in a block next to the title or reference number in brackets in the top right corner e.g. (33470) and can be used in place of a name for absolute clarity in identifying a map.
Scale
Land maps are usually scaled as 1:50 000 (read as 1 cm in 50000 cm), this means that 1 cm on the map is equal to 500 meters or 0.5 kilometers on the ground. This is called scale and will help you determine distance on the map in relation to the ground.
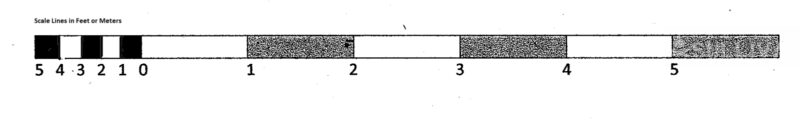
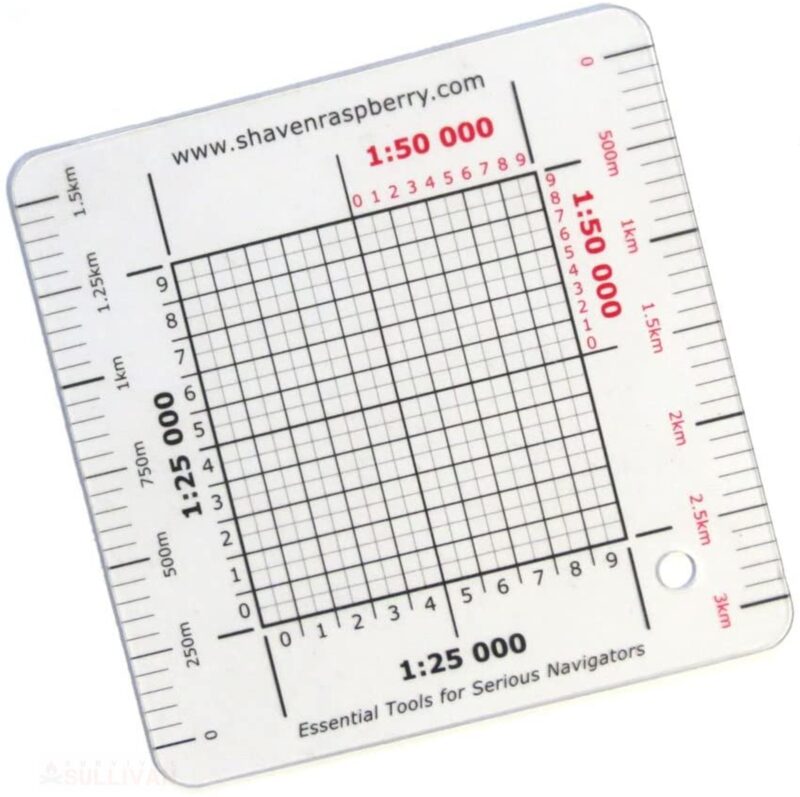
This is what the map scale rule looks like. It’s a 1:50000 scale, 1cm on the map = 500 meters on the ground. 0 to 1 is 1 cm, 0 to 2 is 2 cm and so on.
It has a block set up in to the left, working backwards 0 to 5, each smaller clear and black 2mm block is equal to 100m, half a block (1mm) is 50m and quarter block (0.5mm) is 1.25m. This allows you to work out smaller rations of distance as measured with your ruler or string.
Example: 3.6 cm is 3 cm 4 mm.
Scale:
- 3 cm x scale 500 meters = 1500 meters or 1.5 kilometers
- 4 mm x scale 100 meters = 4 meters
- 1500 meters + 400 meters = 1900 meters or 1.9 kilometers
Let’s say you are hiking through an area and need to figure out how far it is to the next overnight stop, which you cannot see because it’s behind a hill.
Using your map, you can figure out which route to take, how strenuous the route will be in relation to the terrain and how far it is. These factors will help you determine the time needed to travel this distance.
Magnetic Declination
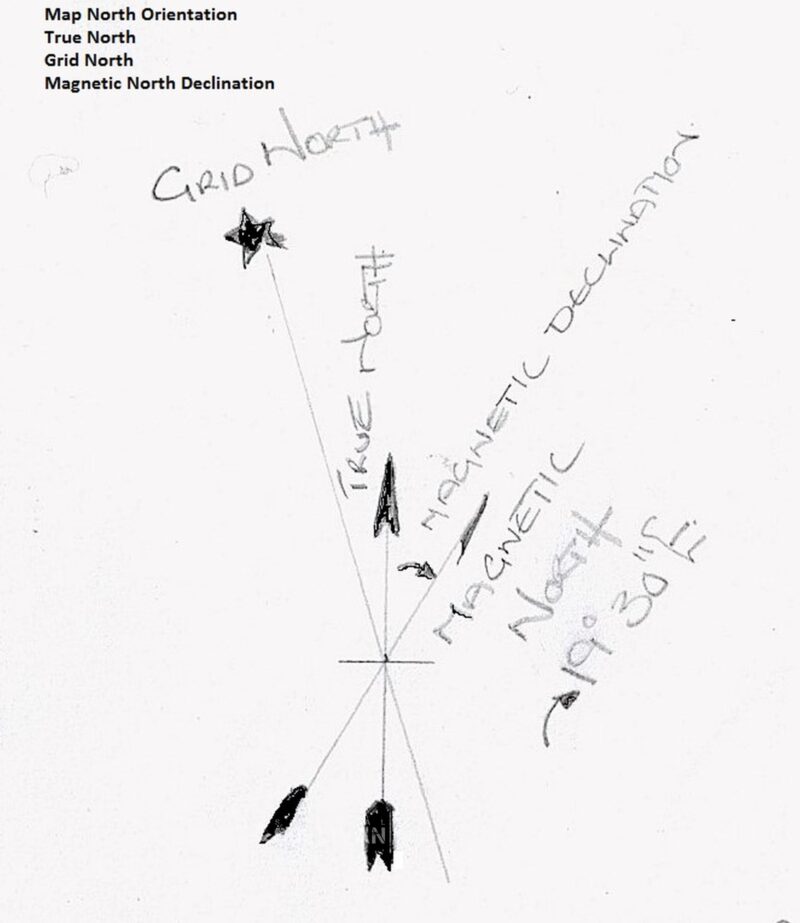
The North Pole is considered the True North indicated by the bold black arrow, it’s the imaginary line that the earth’s axis moves through on its travel to the South Pole.
Just to mess with us, we have a massive magnetic pole in Greenland which, indicated by the half arrow, which when using a compass, draws the needle in its direction, taking us off course by several degrees.
This variance in is called magnetic declination, and is shown on all topographic maps. It changes slightly over time so your map must be updated.
Using a compass to find North you must allow for the magnetic declination by setting north according to the variance in order to maintain a true course.
The Top of the map is always North and the thin blue line dissecting True North in the layout is the grid north. Your map will then align naturally with the true north and the landscape.
Conversion Table
Some maps will show a metric conversion table. This table is normally found on aeronautical maps where height above ground is critical.
Conventional Signs
To show roads, rivers and rail lines each is assigned a symbol on the map in order to condense information and indicate position and direction all within the space provided by the map.
Symbols are allocated for vegetation, settlements, infrastructure and landscape features. Also called the map’s legend.
The legend helps to decipher the map, highlight important features and key points, which aids orientation of the map to the ground.
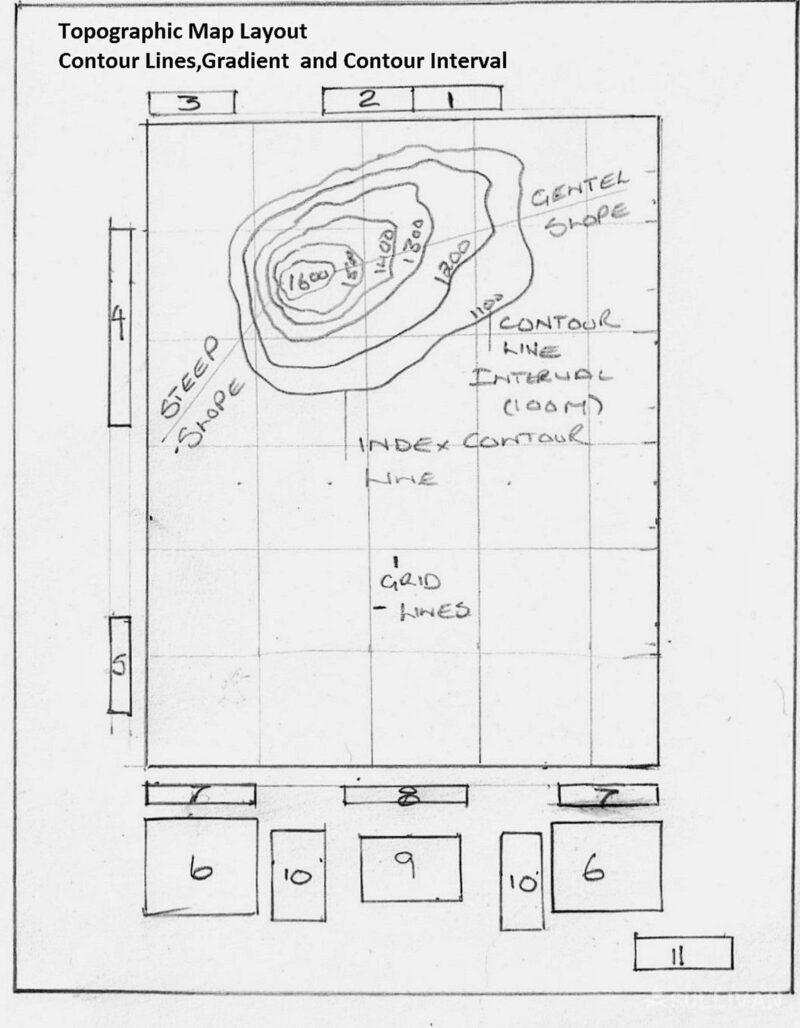
Contour Lines and Contour Interval
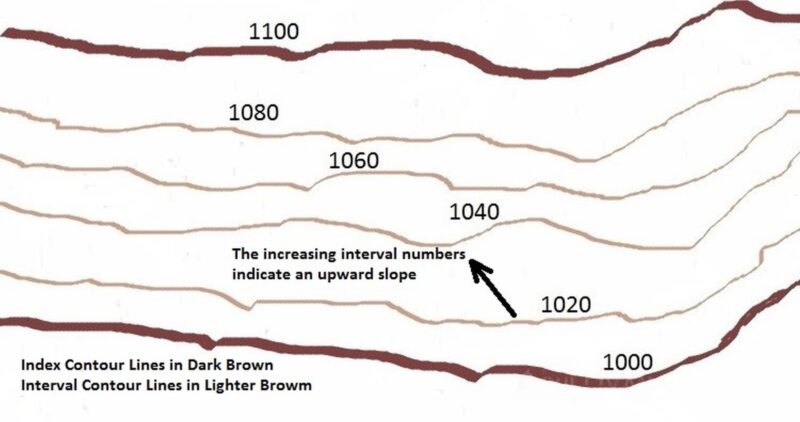
A Contour Line is a solid line joining places of the same height. The dark index lines are shown are represented in 100 meter or feet between the next index contour line. Between the index contours are four fainter contour lines going up in 20 meters or feet increments.
The Contour Interval is the space in between two contour lines, this space is the interval between the lines. It is given a set value and the lines themselves connect to themselves along this value.
They do not cross or touch each other, the closer they are to each other the steeper the slope and the further apart, the gentler the slope.
The intervals represent height in altitude, the wider apart they are the easier the climb to the next given height e.g., if point A is 1100 meters above sea level and point B is 1200 m and the distance traveled between the two lines is 100 meters in a straight line. The intervals represent altitude and gradient.
How?
Divide the change in elevation between point A and point B (100 meters as expressed by the contour interval) by the distance between the two points (250 meters as measured using a piece of sting against the scale lines on the map).
100/250 = 2. 5
This is expressed as a rate of climb 1m to 2.5m, for every 1 meter travelled you will gain 2.5 meters in elevation.
Scale Lines
Found at the bottom in the center of the map margin. These lines are given in feet, miles or metric meters and kilometers Measuring a route with string, the string can be measured against the scale lines in order to determine distance on the map and in real time on the ground.
Indenting Sheets
This box is found below the scale lines. The indenting sheets are the adjoining sheets, which can be joined to the existing map to give a greater overview of the area.
Map Coordinates
The maps orientation along the lines of latitude and longitude are given as map coordinates. This information will help you determine grid refencing, when a compass is used you can determine your position along the cardinal points i.e., North, South, East and West.
Determining a grid reference and its use will be covered later in this article.
Map Date and Revisions
If your map is out of date the magnetic declination will also be out date. This difference will lead to inaccurate calculations for true North and take you off course.
Features would have changed e.g.; a dam has been built in the meantime flooding the region and changing what you actually see.
Map Reading Without a Compass
Using a map to find your way as is old as time. The aim of this article is to use the map accurately and to your best advantage.
As I said earlier, we want to match the map to the ground and the ground to map. The first step is to obtain a map of your area.
A topographical map is ideal but you can use a road map with scale, map books covering larger areas across the states, these are cheap or you more than likely have one or more.
The principles discussed here for orientating a topographical map or Topo Map are applicable to virtually all maps. Practice and exposure are the driving force of theoretical learning.
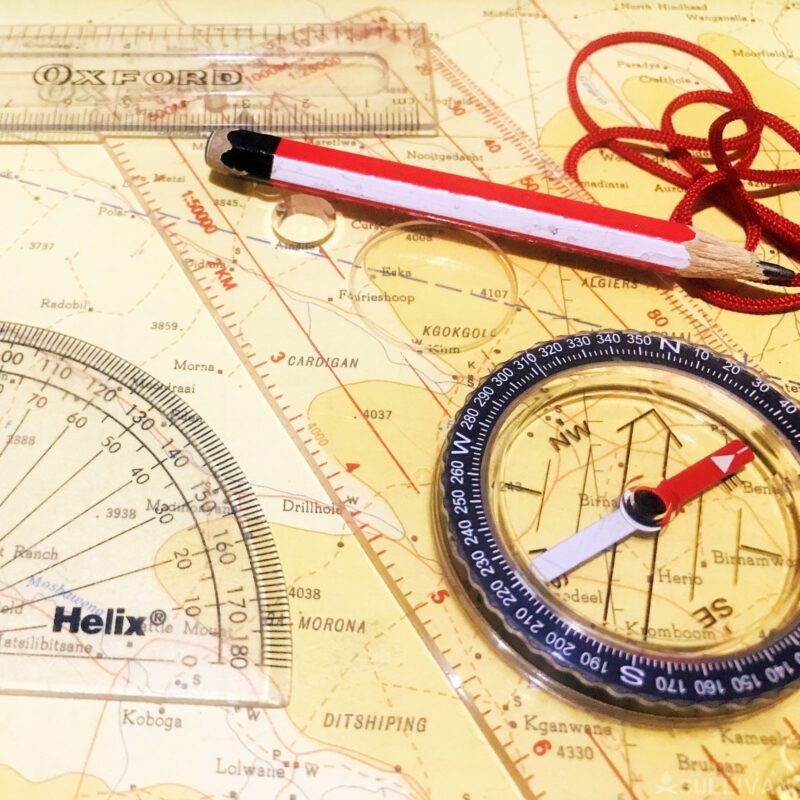
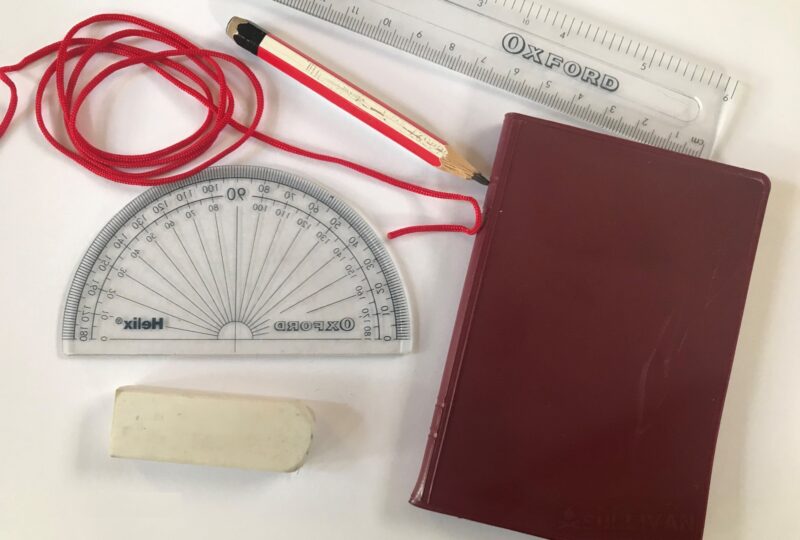
You will Need
- Thin string, approximately 20 cm in length
- Ruler – 15 to 30 cm’s long
- Soft pencil
- Eraser
- Notebook
- Protractor to assist with angles
Taking it Outside
The best place to practice and get a handle on map reading is outside. Taking a look at your map, you’ll see it is an aerial view of what is in front of you, whether it’s a road map of your neighborhood or a topo map of an area you are familiar with.
Your aim is to match what you see outside to what you see on the map. The good thing is that roads and by roads are clearly marked in red or brown. Rivers and dams are colored blue for easy recognition and natural features in green or shades of brown on most maps.
Maps are extremely accurate now, access to GPS ground tracking, satellite and aerial photos has increased our knowledge of all areas of the world. Even moving in remote, off grid and desolate areas, it is possible to find your way using an accurate map of the area.
Direction
First things first, draw two light lines in pencil, so you can rub them off later, on your map from a known position to two recognizable features on the map. For example, your back yard, a street intersection or the lookout position to the two features on your map.
From your position turn your map till one of the lines matches up with the feature, the other line should automatically line up allowing all the other features to fall into place. This is called orientation of the map, or setting the map.
The top of the map is always North, so without a compass you have also orientated yourself North.
This doesn’t negate using a compass, once you have set your map use a compass to fix your position.
Using the Map to Assess Scale
Land navigation maps are usually drawn on a 1:50000 scale. Where 1cm is equal to 50000cm’s on the ground or 1cm equates to 500 meters/0.5 kilometers.
Any line between two points can measured to determine the distance between these two points using the scale. Using the map grid to refine your position and the position you wish to travel to, will significantly increase accuracy.
I will delve into this in detail under the section Map Grid.
An Idea of Scale
Working with only a piece of the map, leaving the scale as an unknown will not throw you off your game. A map is a picture of the ground, it corresponds to what you see, by definition the map distances will correspond to distance on the ground.
If you know the distance to a spot you are familiar with and it takes you 10 minutes to walk there, it will take 10 minutes to walk to similar points that correspond with that distance. From this you can figure out the scale of your map.
If the known distance is approximately 1000 meters from your starting point, measure the distance on the map. For convince say 1 cm, that means your scale is 1:100000 or 1 cm = 100000 cm on the ground.
Bear in mind this is a general sense of scale and not exact.
Conventional Signs
Maps are a representation of the environment in miniature, so not everything can be placed on a map. Firstly, clutter on a map will become confusing and could disorientate the user, secondly some are so small by scale that they are best represented by a symbol.
It is imperative that you are familiar with these signs and symbols, it will speed up your map reading ability.
Signs can be broken up into six main categories:
- Farm Lands and Orchards are depicted in shape and form but not as type or specific cultivation.
- Roads and Bridges are not drawn to scale, national roads are drawn in red, secondary roads in brown and dirt or farm tracks shown as two black lines. Bridges are clearly marked and defined and depending on the year of print they are very accurate depictions of the ground.
- Buildings are shown on the map as squares within the road grid pattern. Major buildings are either named or shown by a symbol or sign e.g., Hospitals, Schools, Churches, Government Buildings, Monuments and National Key Points.
- Rivers, Tributaries and Streams are true to form and shape and large ones are named e.g., Mississippi River, following the contours. The river can be accurately measured to define width for a possible crossing point for example. Rivers are blue, perennial streams and tributaries are a solid blue line, non-perennial ones are shown as a broken blue line.
- Dams are shown as large water sources in blue, large ones are named e.g., Lake Michigan. Dam walls are shown to scale.
- Vegetation is represented as a general overview or the area, Trees, Bushes and scrub is show by round green circles with a dash under it, to show shadow, bushes smaller green circles without the dash and scrub small green dots. Density is shown by a denser proliferation of these symbols.
Use the ground representation to define the maps intention, if the map is current what you see around you will be represented on the map.
Road maps don’t show contours and vegetation etc., yet are still very detailed, they are designed to help you on your way. Rivers, dams, bridges, buildings and some natural features like mountains will be shown.
Almost all maps are drawn to scale to assist in distance estimation, determining the route to avoid obstacles like a wide river or large lake and time to destination if speed is known.
Understanding the environment has always been man’s way of managing his circumstance.
Whether it be in a survival situation, a combat situation or just finding your way across town or a foreign city, your capacity to navigate your world will give you the confidence to keep going, setting the stage for psychological well-being.
Never underestimate the impact of being lost. Hollywood has dedicated hundreds of movies to the subject.
Map Grids, and How to Use Them
Lines of Longitude and Latitude encircle the earth, longitude on a North to South Axis and latitude on an east to west axis or vice versa. Each line has degrees of angle which lead off it in various directions.
The most well know line of latitude is the Equator with a value of 0˚ degrees. The Prime Meridian is the Equator of the N/S Longitude and has a value of 0˚ degrees.
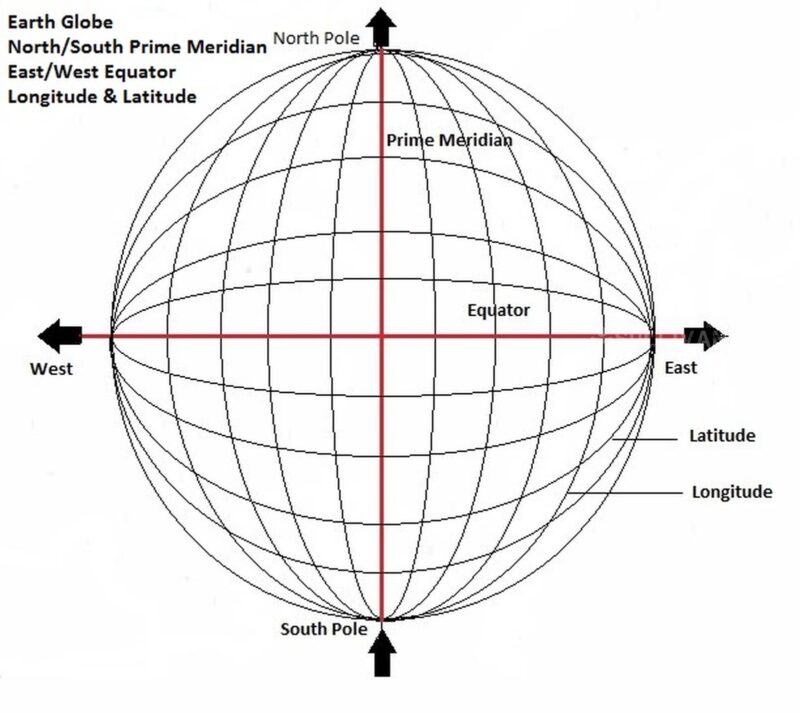
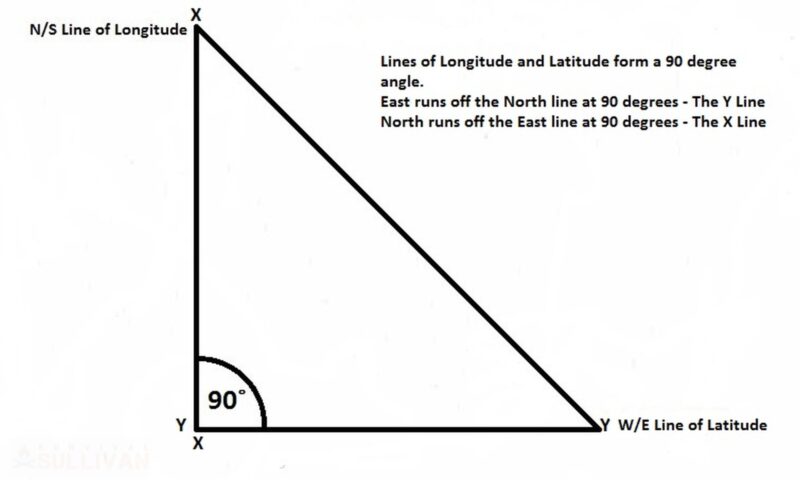
Lines of Longitude define an east west angle at 90˚ degrees and lines of Latitude define the North South axis at an angle of 90˚. What does this mean I hear you say!
Somethings are just easier to grasp when put down on paper. Looking at your map you’ll find a grid pattern is laid over the map.
Each line of the grid is given a value North and South, East and West. Following the lines and seeing where they converge will give you a position.
The golden rule of grid referencing is to begin on the bottom-line Y (E/W) or Easting line and then follow it up the N/S line, X, the Northing line.
The old math’s saying, Along the Corridor and Up the Stairs, will help you remember.
Let’s take a look:
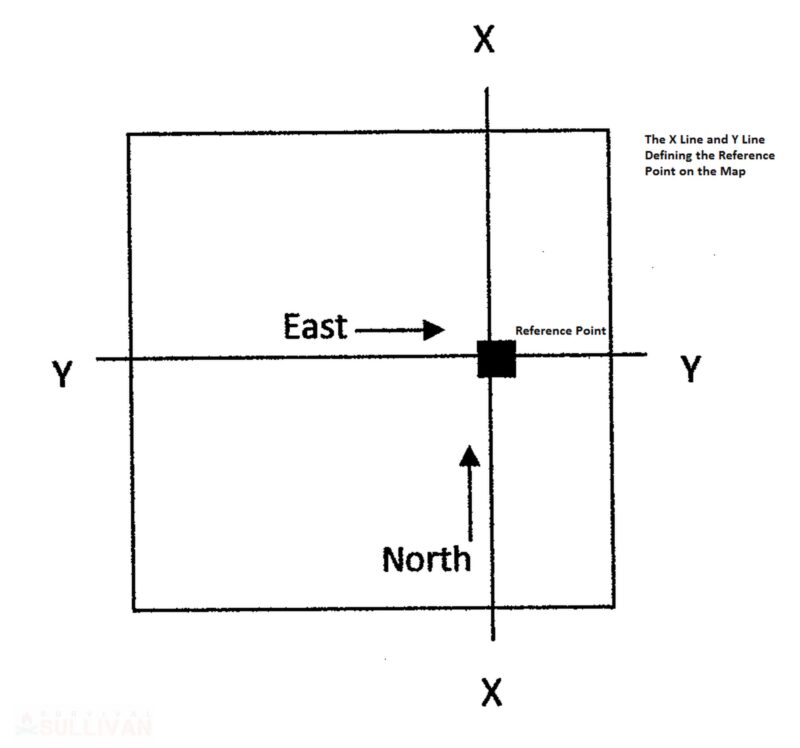
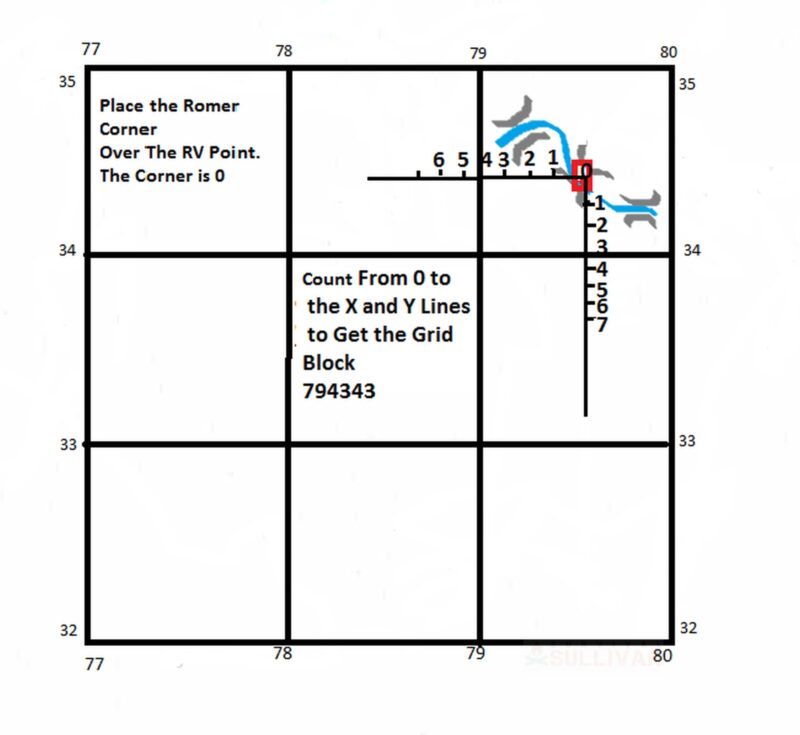
The diagram has a reference point marked as a black square. To navigate to this point, begin on the Y line moving East and then the X line moving North till your points converge on the reference point.
The grid block covers a wide area, usually 1000 meters by 1000 meters or 1000 m2 or as in the USA in feet squared.
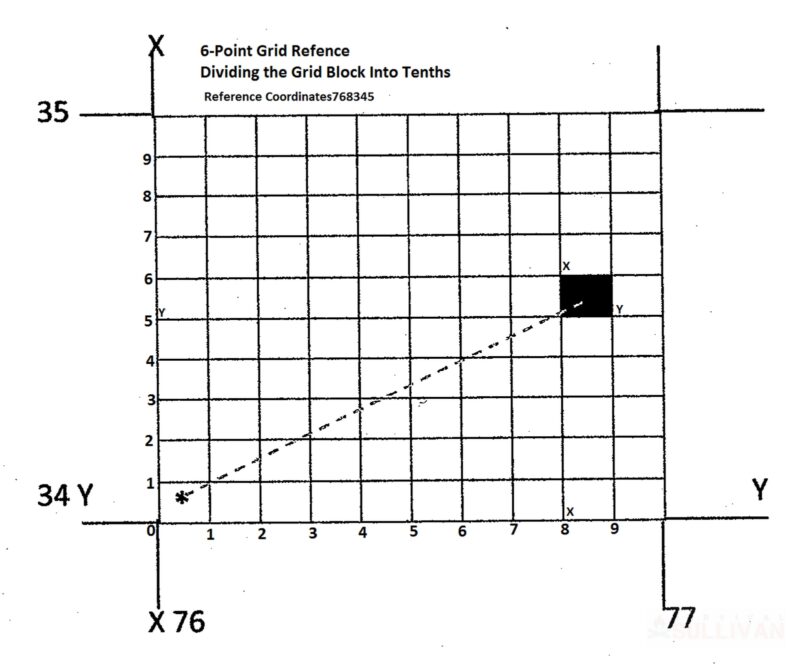
To help narrow down the reference point marked by the black square in figure 4, the block is broken down into smaller squares, 10 in all, 100 meters by 100 meters, 100 meters squared. This will aid in refining your point of reference on the map and then in relation to the ground.
Similarly, when you are looking for a specific house on a street, you find the closes corner, then turn left or right and follow the street numbers until you reach the house.
On a map you do the same, for convenience and ease of use we move left to right West to East and Down and UP, South to North.
The 6-point grid refence for this would be 765/348.
By narrowing down the area in to which you want to navigate you reduce the likelihood of missing the RV or rendezvous point.
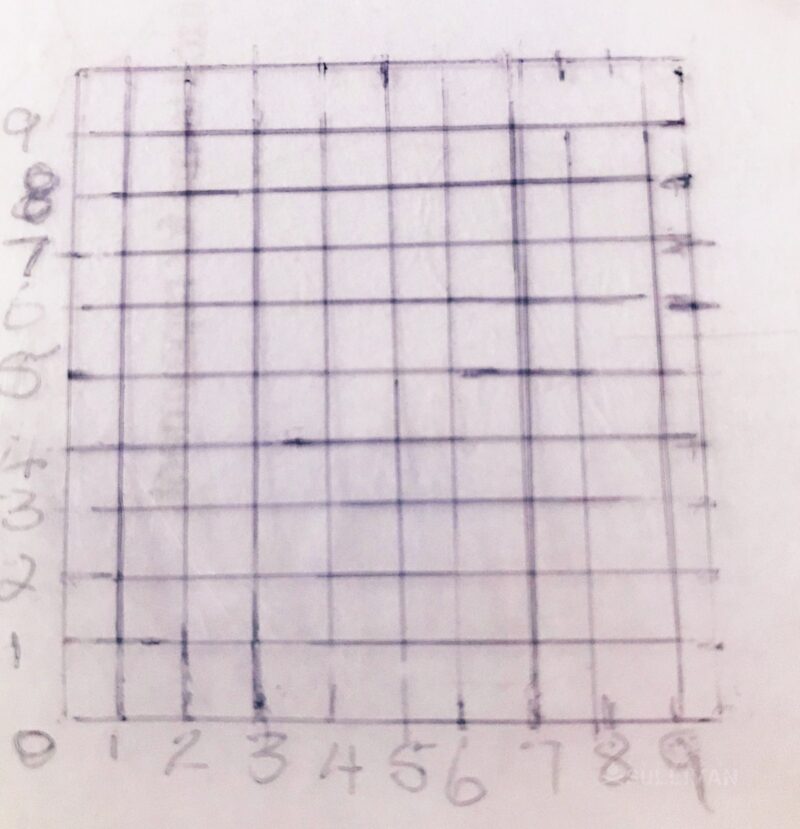
Each tenth block can be broken up into a grid of ten blocks, refining the accuracy even further. There is not finite number that these blocks can be refined down to, the map can only handle so many before you cannot physically track the reductions.
GPS tracking and satellite navigation can reduce these number to an infinitesimal number to pinpoint a position. Modern guidance systems are incredibly accurate so that aircraft can land with safety, ships can remain on track at sea and our vehicles can find our destination.
Modern equipment can fail or we can be stranded without it, so “old school” navigation becomes our “go to”. No travel should be planned without the bare necessities of navigation.
Using a Romer
This is a right sided plastic square that is placed over a grid block in order to assist with measuring and finding the reference point within the grid block.
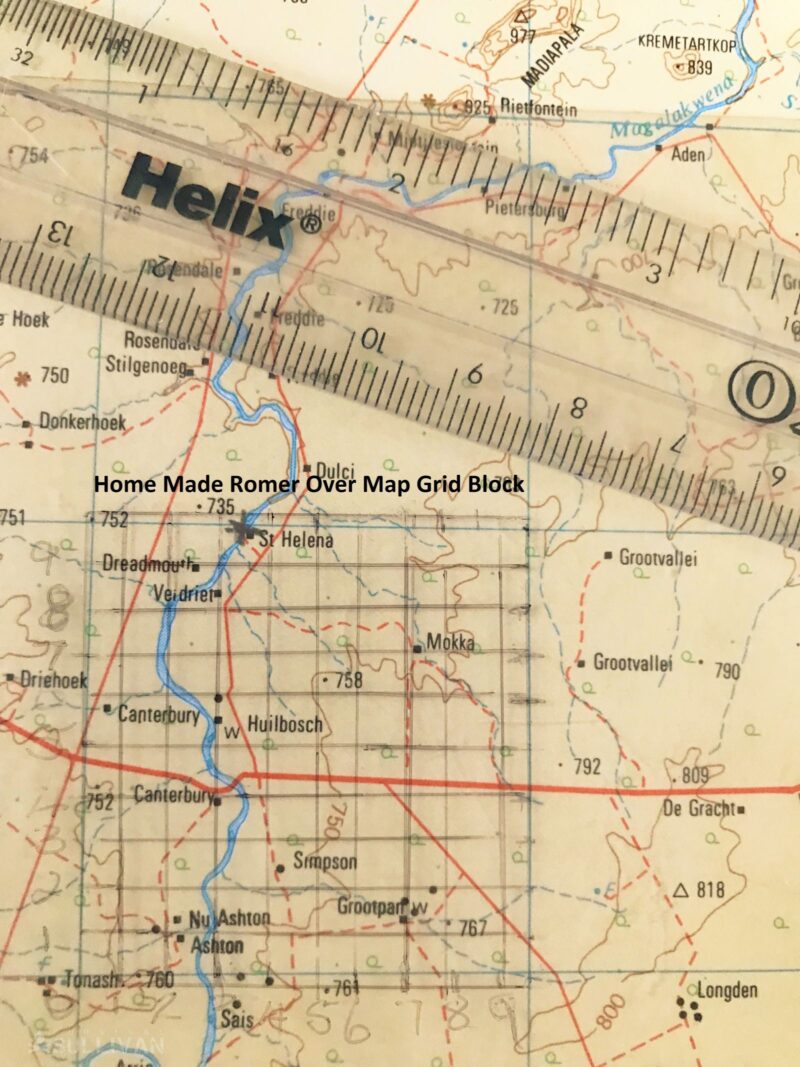
It can be home made as the picture below shows, its simple and easy to draw on a clear lightweight plastic sheet. What is important is that you stick to the scale of the map, in this case a 1:50000 scaled map.
This is my romer over an actual map:
These are easy to purchase online, at the local flying school, a map studio or a stationary shop.
Let’s take a Look:
- River in Blue
- Using the Conventional Sign for Bridge
- Red Marks the Reference Point or Rendezvous Point for the Hiker Group
Place the Romer Corner over the RV Point, that is zero.
Following the Golden Rule, “Along the Corridor, Up the Stairs.”
The Easting coordinate is 34, counting back to the North/South line using the Romer, the number is 4. The Eastings coordinate is 344, the Northing coordinate is worked out the same way, the coordinate is 794.
The coordinates for the bridge are 794344, using the Romer you have fixed the position and will meet up with your hiking group.
Measuring Distance to a Point
Using the refence point diagram as a reference, you are at 765/348 marked as the dot in the square. The first measure is “As the crow flies”, a straight line between two pints is the shortest distance that you could travel.
The physical ground may have other ideas. Hills, rivers, boulders, thick vegetation may have you walking around off the direct course.
Draw a line between the two points and measure this against the scale of your map, 1:50000 or 1 cm = 0.5 kilometers.
Distance from your point to the reference point is 5.5 cms.
5.5 x 0,5 = 2,75 kilometers as the crow flies
Using the contour lines and conventional signs and symbols, you can plot your course on the map to take you over the ground to your reference or rendezvous point. Using the string you measure your route, winding around, across or over obstacles to follow the ground indicated on your map, which also follows the contours.
You may want to draw the route directly on to the map, using your soft pencil, allowing for easy removal later.
Take the string measurement and using the map scale you can determine the route distance on the ground.
Route to RV point is 7.8 cms
7.8 x 0.5 = 3.9 kilometers
Taking gradient and weather conditions into account, plus your backpack, you know you can cover 3 kilometers in an hour so you can estimate your time of arrival (ETA) at the RV point to be in 1-hour 30 minutes.
How?
The formula to determine speed is distance divided by time
3,9 kilometers divided by 3 kilometers per hour (approximate walking speed) = 1,3 hours to walk from your position to the RV point.
Using a formula, we can determine speed, time and distance
There are Three different ways to use this formula:
- distance ÷ time = speed 3.9 ÷ 1.3 = 3 kilometers per hour
- speed × time = distance 3 x 1.3 = 3.9 kilometers
- distance ÷ speed = time 3.9 ÷ 3 = 1.3 hours
Plotting your course, estimating your time to travel this course and working out the actual time you traveled are now all within reach using this simple formula and your map.
If your calculations for distance are slightly out you will walk further and longer or vice versa.
This holds for your walking speed, which if affected by natural factors or fatigue or injury, may be slower or faster, changing your time value, making arrival sooner or later.
Map Work as an Essential Skill
In the field of navigation, the Map is an essential part of your survival preparedness. This article covers the bare minimum that you will need in order to read and use a map. I have given you a few shortcuts to help you order your map work:
- The top of the map is always North
- The map is a representation of the ground
- Features on the map will match features on the ground
- Maps are drawn to scale
- Map scale is used to determine distance
- Use the formula to determine time or distance or speed, the map will aid you to establish estimated answers.
- Topographic lines represent height and gradient.
Expose yourself to nature, practice and hone your map skills. There is no substitute for experience and experience is usually gained about 20 seconds after you needed it, take your time and keep up the work.
last updated 02/06/2022 by Harrison Ford

Like what you read?
Then you're gonna love my free PDF, 20 common survival items, 20 uncommon survival uses for each. That's 400 total uses for these dirt-cheap little items!
We will not spam you.
This article is nicely written, but I should point out that some of the information is slanted toward maps tending to be available to citizens in the United Kingdom. In the United States, most topographical maps available to civilians are 1:24,000 scale. 1:50,000 and 1:25,000 are military tactical maps in the US. They are available, but usually you have to save and collect those scale maps from the military. They aren’t classified (in most cases). Beats me why they play with the scales like that. I have a nice collection of military topo maps from my time in.
As long as you are aware of the slight scale differences in maps available from the USGA (US Geological Agency) and have an appropriately scaled romer, you will be fine. The techniques work the same. In the US a romer is usually called a map protractor. I have a bunch of different ones, but in the end, they work the same. When working the field, I preferred protractors made of heavier plastic. The floppy GI protractors had the benefit of being free.
I should note, that if you plan to call in artillery or air strikes, you should use the military scaled maps. If not, no big deal really. Just something to be aware of and to ensure you have the correct protractor/romer.